Instagram Live statistics is more than just a feature – it’s a powerhouse for audience engagement, marketing, and community building.
With real-time broadcasting capabilities, it has fundamentally reshaped how users and brands interact.
Let’s uncover the numbers behind Instagram Live, explore its applications, and highlight how it drives measurable growth.
Table of Contents
Instagram Live Usage: Key Figures to Know
Over 100 million users engage with Instagram Live daily, making it one of the most actively used features on the platform.
Among Instagram’s total 2.35 billion users, approximately 23% of active accounts report using Instagram Live regularly.
This feature sees higher engagement compared to Stories and Reels, with an average view duration of 3-10 minutes per session.
The surge in popularity of Instagram live videos aligns with the rise of interactive content consumption, particularly among younger audiences.
61% of Instagram Live users fall into the 18-34 age group, with a near-equal split between genders.
Instagram Follower Count Correlation with Instagram Live
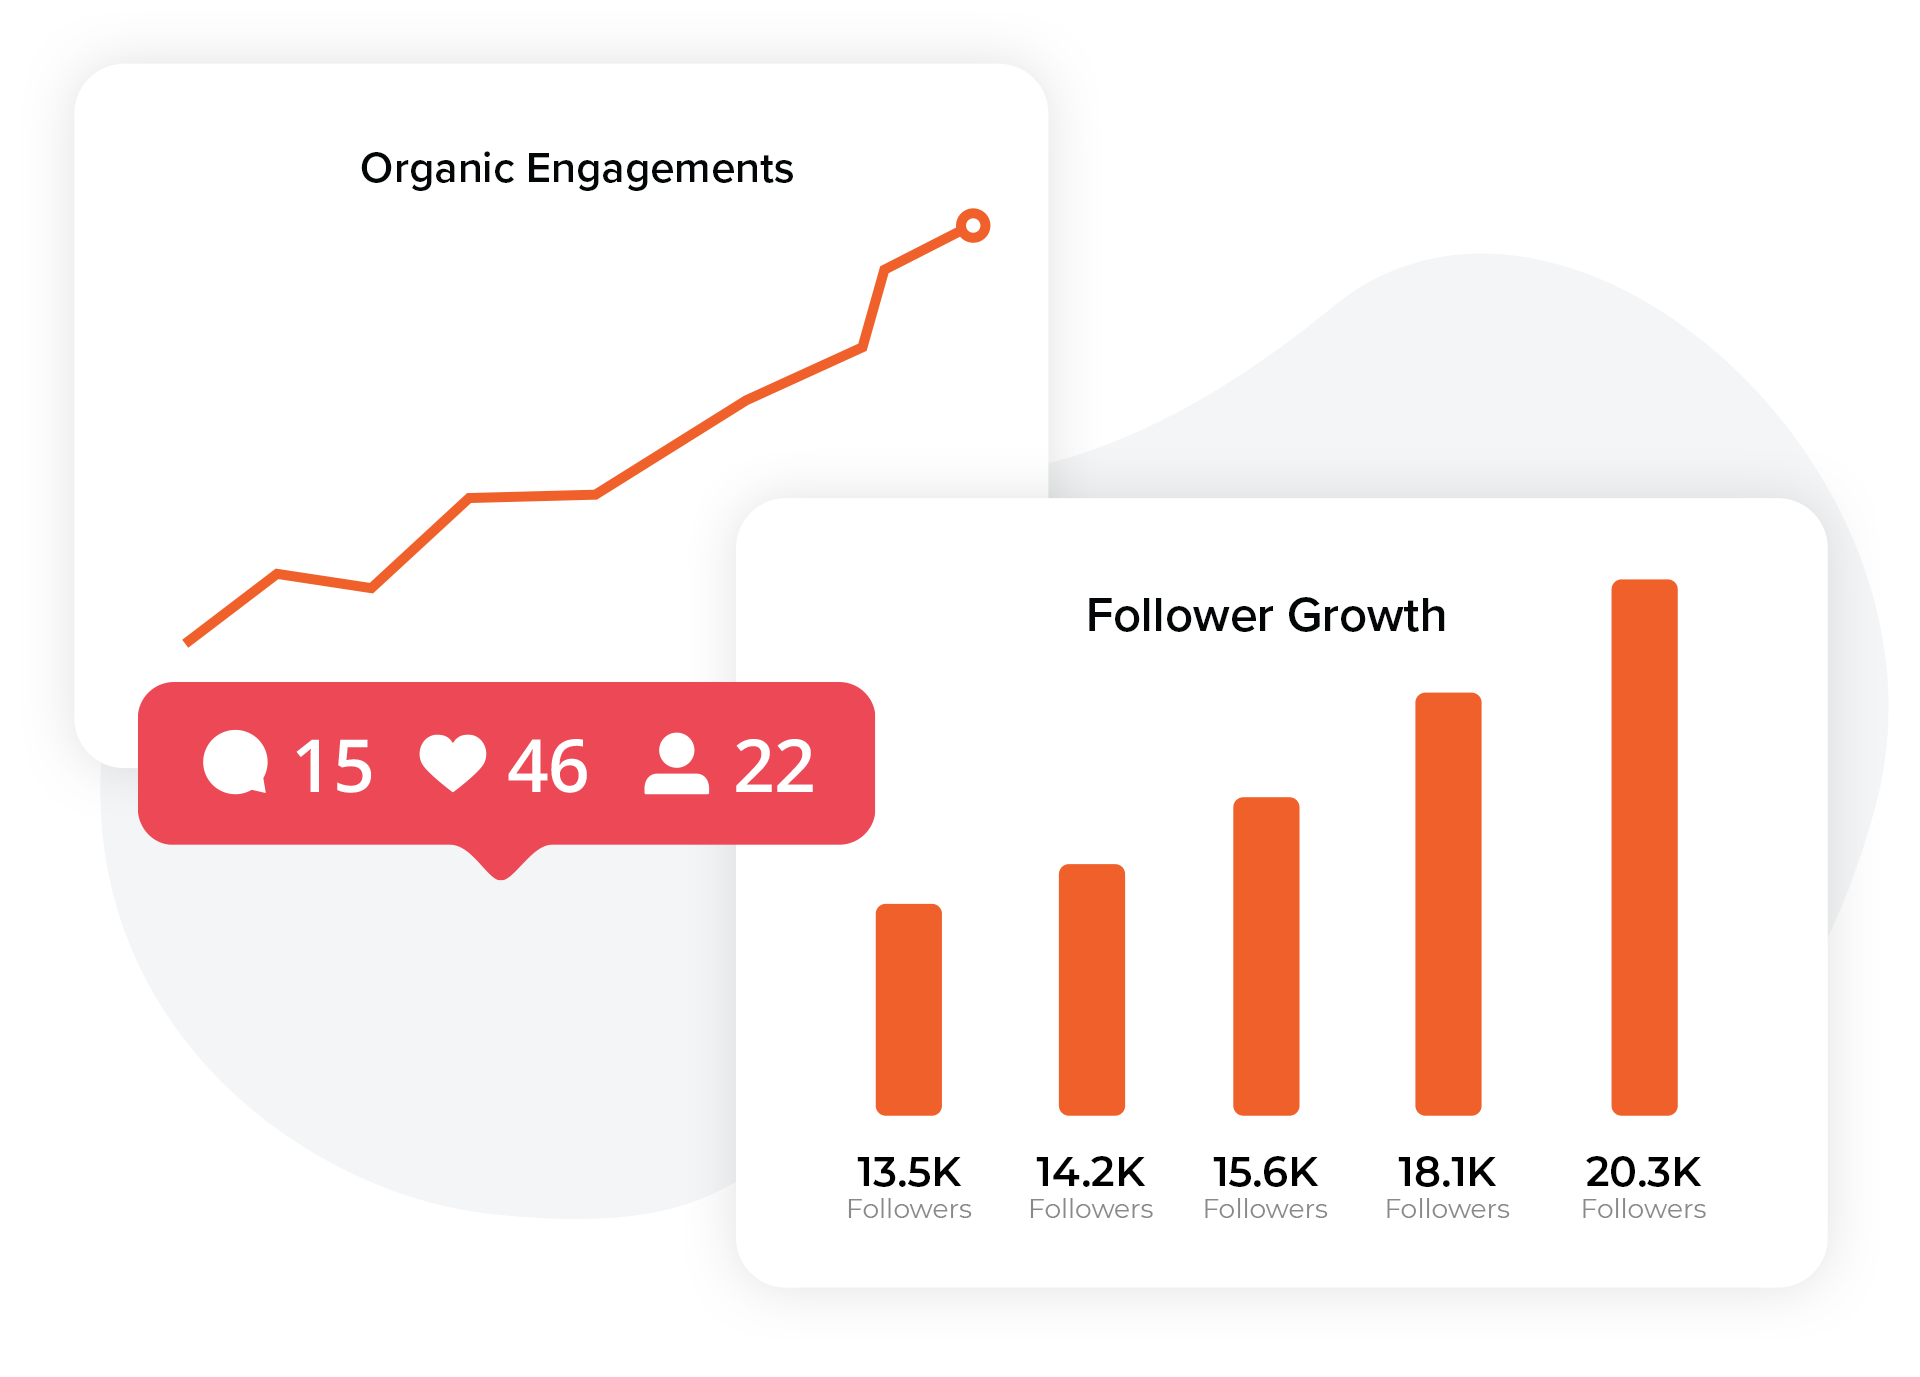
Regular use of Instagram Live correlates strongly with follower count growth.
Accounts that go live at least once a week report a 30% higher follower growth rate than those that stick to static posts or Stories.
Brands with follower counts between 50,000 and 250,000 observed the fastest growth, with an average 10% increase in their follower base over three months when using Instagram live videos.
For example, a tech influencer with an initial Instagram follower count of 100,000 gained 15,000 new Instagram followers after consistently hosting weekly live streams for six months.
Industries Benefiting from Instagram Live
Instagram Live has found application across industries, with each leveraging the tool for unique goals:
- E-commerce: Product launches and tutorials through Instagram live videos increase purchase likelihood by 22%, especially during seasonal campaigns.
- Fitness: Live workouts have become a staple, with trainers reporting an 18% uptick in engagement rates during live sessions compared to recorded content.
- Education: Online courses and live Q&A sessions see participation rates improve by 35% when using live streams over pre-recorded webinars.
These statistics underline the adaptability of Instagram Live across various sectors, catering to both creators and consumers.
Engagement Rate Comparisons
Engagement rate is a critical metric to assess the success of content strategies.
Live videos on Instagram boast an average engagement rate of 4.6%, surpassing regular photo posts (1.2%) and Stories (3.1%).
The interactive features of live sessions – comments, questions, and reactions – contribute significantly to these numbers.
Peak engagement times for Instagram Live align with user activity trends on the platform.
Streams scheduled between 6 PM and 9 PM (local time) record 30% higher engagement rates, making it a prime slot for creators and brands.
Monetization: Turning Live Streams into Revenue on Your Instagram Account
Monetization through Instagram Live has gained traction with the introduction of tools like Badges.
In 2024, creators have earned an average of $1,000 per month through live badges, with top-tier influencers making as much as $5,000 per session during high-profile events.
E-commerce brands are also cashing in.
Companies hosting live shopping events reported 28% higher sales during live sessions compared to promotions through Stories.
Fashion and beauty brands, in particular, have seen significant ROI, with one luxury retailer generating $150,000 in sales from a single live-streamed launch event.
Tracking Growth Through Instagram Live Analytics
Instagram provides extensive analytics for Instagram live videos, offering insights such as:
- Peak viewer count: The highest number of concurrent viewers during a session.
- Average view duration: Indicates audience retention, with successful streams averaging 7-10 minutes.
- Engagement trends: Monitoring comments, likes, and reactions helps identify what resonates most with the audience.
Creators using analytics to fine-tune their approach report 15% higher audience retention rates and a clearer understanding of when to go live.
For instance, adjusting a stream schedule to match the audience’s most active time (based on the Insights tab) boosted live attendance by 40% for one creator.
Live Events and Target Audience Engagement
Hosting a live event through Instagram is a proven way to engage with your target audience effectively.
Studies indicate that 40% of users who attend live streams are more likely to interact with a brand or creator in subsequent posts.
Additionally, live sessions with giveaways or exclusive announcements see double the average engagement compared to regular streams.
For example, a travel influencer hosted a live Q&A about affordable destinations, attracting 3,500 viewers and gaining 1,200 new Instagram followers overnight.
Date Range Optimization for Live Content
Scheduling and consistency play a key role in maximizing the reach of live streams.
Based on Instagram’s internal data, accounts that post Instagram live videos within a set date range (e.g., twice a week for one month) experience steady follower growth and increased engagement.
This approach also helps identify trends by analyzing which days and times generate the most interest.
For instance, a weekly series by a food blogger on Friday evenings gained a consistent viewership of 25,000 per stream, with viewers citing the predictability of the schedule as a significant draw.
Key Features Driving Instagram Live Success
The success of Instagram Live lies in its unique features, including:
- Real-time interactivity: Comments, reactions, and Q&A tools ensure active audience participation.
- Dual streaming: Co-hosting with another creator or guest doubles viewership, with streams reporting an average 55% boost in engagement.
- Pinning comments: Highlighting key messages or links boosts click-through rates by 18%, particularly during promotional live sessions.
Future Trends for Instagram Live
Looking ahead, Instagram Live is set to incorporate more advanced features such as augmented reality filters, allowing for a more immersive experience.
The anticipated integration of AI-driven analytics will further enhance tracking growth and identifying trends, giving creators a competitive edge in audience retention.
Additionally, as live shopping gains momentum, Instagram plans to expand its commerce tools, allowing users to shop directly during a live event.
Analysts predict that live shopping on Instagram could grow into a $10 billion market by 2025.
Conclusion
Instagram Live continues to dominate as a preferred tool for real-time engagement, offering unmatched opportunities for growth, interaction, and monetization.
The statistics reveal not only its widespread adoption but also its potential for driving tangible results across industries.
For creators and brands willing to dive deep into analytics and craft interactive content, Instagram Live is an invaluable asset that promises sustained growth and innovation.
Frequently Asked Questions
How to see Instagram live statistics?
To access Instagram Live statistics, you need to use the platform’s Insights tool, available for Business or Creator accounts.
After you end your live video, navigate to the Insights section on your Instagram account.
This is where you’ll find detailed metrics about your live session. Key data includes:
- Viewer count: The total number of unique users who joined your live session.
- Engagement metrics: How many comments, reactions, and shares your live session received.
- Duration insights: The average time users spent watching your video.
These statistics help you gain a clear understanding of how your audience interacts with your content in real-time.
For example, if your engagement spikes at specific moments, you can track this pattern and optimize future sessions.
Additionally, some third-party services offer more advanced analytics for in-depth data analysis, allowing you to compare your live performance with your regular posts.
How to see live analytics on Instagram?
To view live analytics, begin by ensuring you have a Creator or Business account. After finishing your live video, head to the Insights tab.
This tool provides metrics on your stream, such as:
- Peak viewer count
- The total number of comments received
- User retention throughout the session
If you want to dive deeper, Instagram’s analytics also allow you to track your performance over a specified date range.
Look at trends like which Instagram username engaged most frequently or which content resonated best.
For creators or brands looking to pay for additional tools, external platforms can offer advanced features like comparing live video engagement against posts and Stories.
Is Instagram Live effective?
Yes, Instagram Live is highly effective for fostering real-time engagement and building meaningful connections with your Instagram followers.
Data shows that accounts utilizing live video regularly experience up to 30% higher engagement rates compared to static posts.
Its interactive features, such as comments and Q&A sessions, create a two-way communication channel that keeps your Instagram followers invested.
For businesses, Instagram Live has proven to be a game-changer.
By hosting live product launches, tutorials, or Q&A sessions, brands can significantly boost their metrics.
For example, a business that streamed a live event saw an increase in their real-time Instagram followers, with a 20% spike in video views compared to pre-recorded content.
It’s also an effective way to gather audience data, identify trends, and adjust your strategy accordingly.
Can you see video analytics on Instagram?
Yes, Instagram provides comprehensive analytics for both regular and live videos.
For regular uploads, navigate to the Insights section under the specific post. You’ll see detailed metrics such as:
- Video views: The total number of times the video was played.
- Engagement: Likes, comments, and shares.
- Audience retention: How long users watched before dropping off.
For live videos, you can access analytics immediately after your session ends. This includes data like peak viewer count, total engagement, and the duration of the stream.
You can also use these analytics to track trends over a specified date range.
Having access to this data ensures you have a clear understanding of what works and what doesn’t, helping you improve future live streams.